

How bad does your state gerrymander?
The Gerrymandering Report Card is in and it's not a fair fight.


Last post, I wrote about the basics of gerrymandering—how states differ in how they redraw political maps and why Texas is the epicenter—though not the final actor—in today’s congressional map wars.
But, what about all the other states? How biased or fair are their congressional maps? Lucky for us, the brainiacs at Princeton University’s Gerrymandering Project have taken on the job of grading every state’s maps for fairness and partisan bias.
Using a bunch of math, the folks at the Gerrymandering Project look at how fairly each state draws its districts—including election results and whether there’s an obvious partisan bias.
After all this, they give each state’s map a letter grade. Simple enough: A means fairly drawn district paps; F means horribly gerrymandered maps.
How Every State Scored
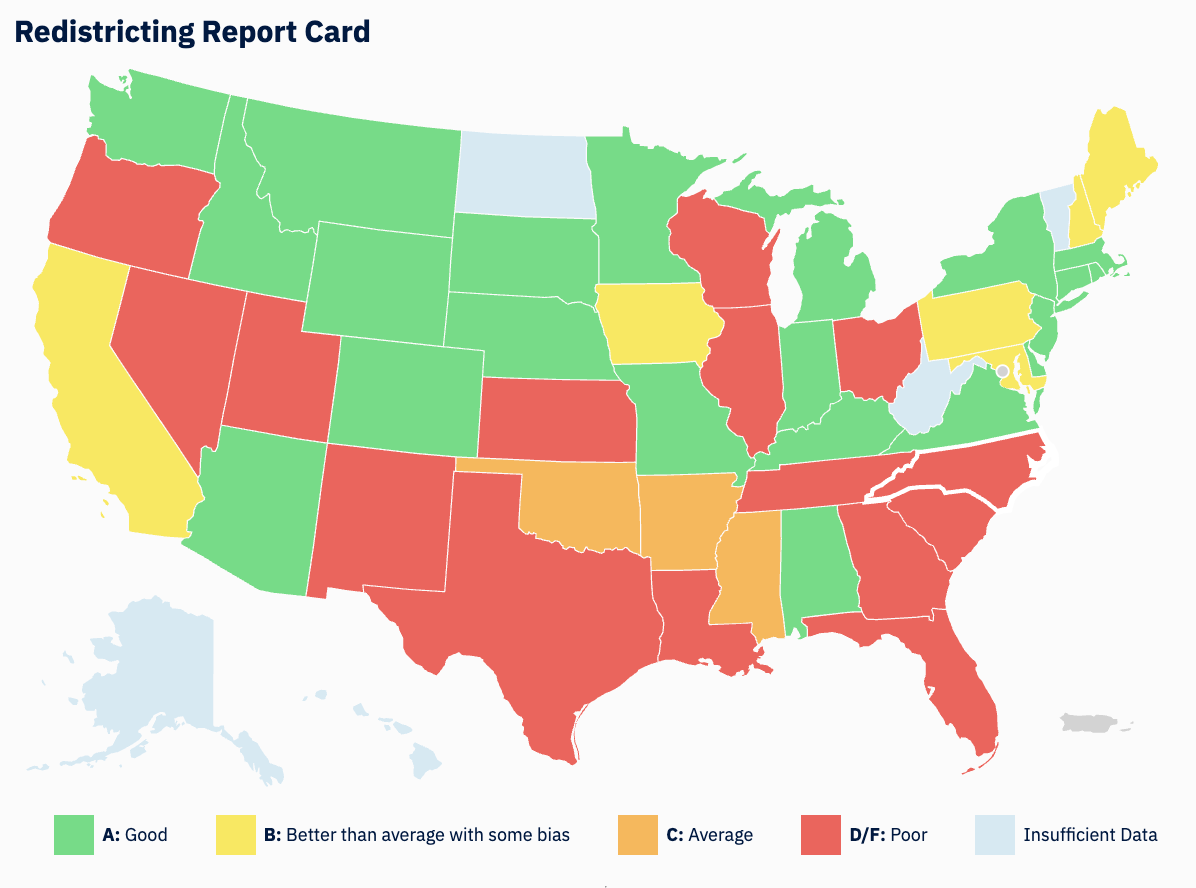
Across the country, the maps’ quality varies wildly. Some states scored an A for relatively fair maps. Others landed squarely in F territory (sup, Texas?), signaling that their congressional districts are…how do we say…less than fair.
Which Party Benefits More?
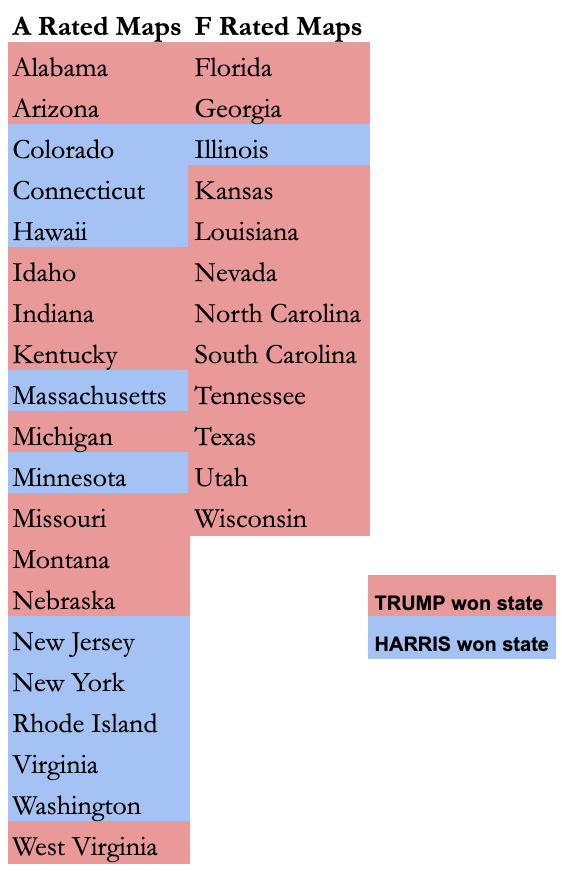
The question isn’t whether gerrymandering happens—both parties have proven more than willing to draw maps in their favor. The real question is, which party do the current maps benefit most? And right now, the imbalance is clear: Republicans hold the upper hand in the states where politicians—mainly state lawmakers—still control the line-drawing process.
Of the 20 states that earned an A, it’s a clean split: 10 went for Trump, 10 went for Harris. Fair maps don’t inherently favor one party.
BUT, of the 12 states that earned an F, 11 went for Trump. The lone outlier: Illinois, where Democrats drew some of the ugliest, most distorted maps in the country.
So yes, both parties gerrymander. But right now, Republicans control more of the states where politicians still draw the maps—and that gives them the edge in this arms race. And, not coincidentally, why they’ve proven so willing to kickstart the gerrymandering tit-for-tat in the middle of the decade after the maps have already been drawn.
Who Draws the Maps = The Grades They Get
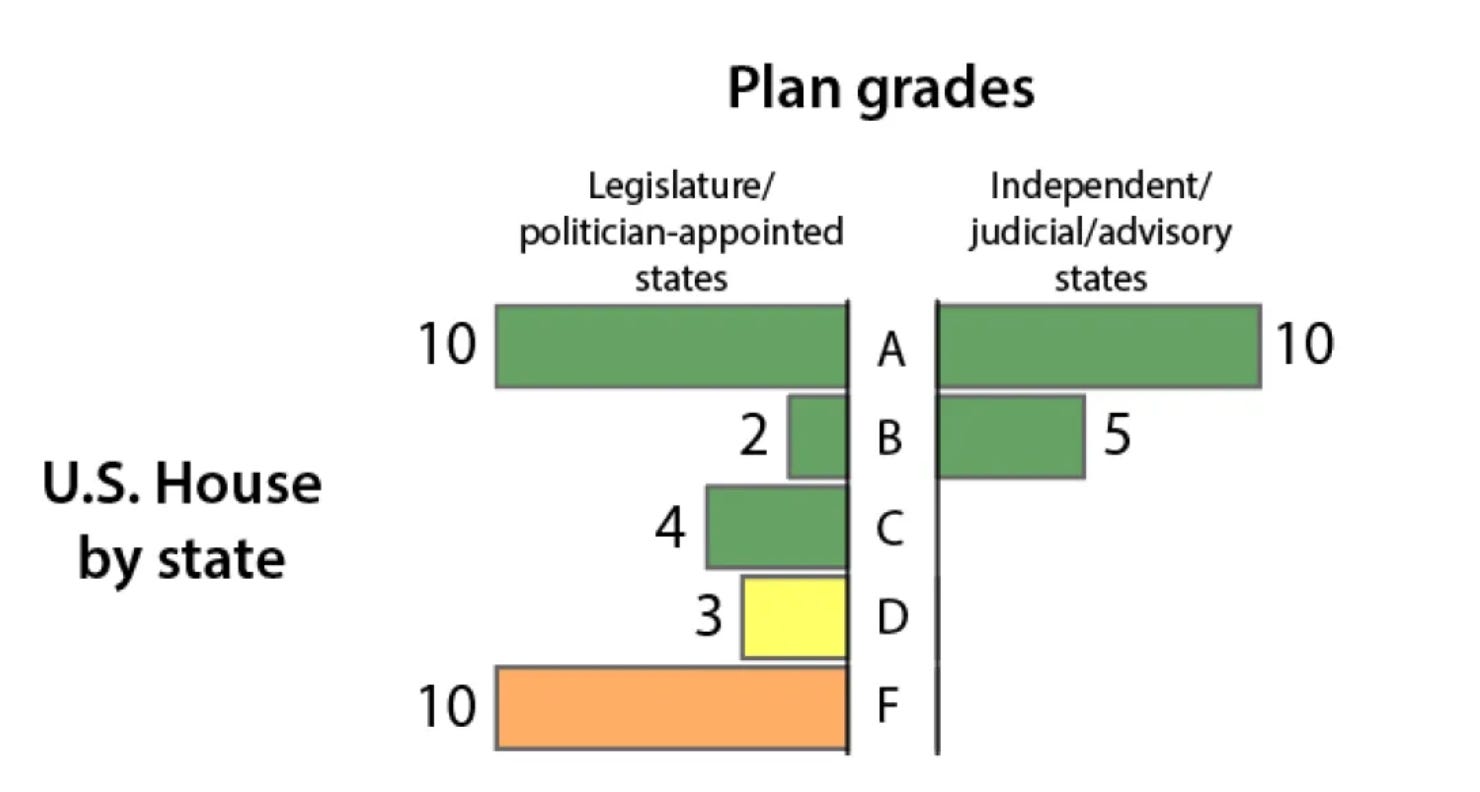
A final, critical lesson thanks to Sam Wang and his Princeton team: Independently drawn maps don’t get bad grades.
States with Redistricting Commissions made up of citizens (think Arizona, California, Michigan) never got worse than a B.
Legislature-controlled states, where politicians pick their own voters, are responsible for all the D and F grades.
This isn’t a coincidence. When politicians hold the pencil, the lines magically tilt toward keeping them in power. When citizens or bipartisan commissions take the lead, the maps are more balanced.
Which means, as in all things politics: Process determines outcome.
 | A guest post by
|
We need to start all over!